Mathematics of Divergent Fractals
The Mandelbrot Set
The Mandelbrot set will be used to illustrate the mathematics of divergent fractals. What is meant by "divergent" should become clear by the end of this discussion. The Mandelbrot set is generated from the Mandelbrot equation:
zn+1 = z2n + c
This equation uses complex numbers for z and c where c is a constant. Complex numbers are numbers with both a real and an imaginary part, and are expressed in the form a + bi, where i is the square root of -1. Another notation for complex numbers is (a, b). The following examples illustrate the behavior of complex numbers:
addition/subtraction: (a + bi) + (c + di) = (a + c) + (b + d)i
multiplication: (a + bi) * (c + di) = (ac - bd) + (ad + bc)i
division: (a + bi)/(c + di) = [(ac + bd) + (bc - ad)i]/(c2 + d2)
absolute value of (a + bi): sqrt(a2 + b2)
Complex numbers are typically illustrated graphically by using a graph where the real component of the number is graphed on the X axis and the imaginary component is graphed on the Y axis.
The Mandelbrot equation is an iterative equation, that is, each value of z generated on the left side is fed back in on the right side to generate a new value of z. This produces a sequence of z values: z0, z1, z2, z3... Typically, the starting point is z0 = (0, 0). Each value of the complex constant c will generate a different sequence. Let's consider a graph with the X axis (real axis) covering the range -2.5 to 1.5 and the Y axis (imaginary axis) covering the range -1.5 to 1.5. Consider that each point on this graph represents a possible value for c, and that iterations start with z0 = (0, 0). Let's determine whether to make a dot on the graph at a given c value based upon the results of iterating the Mandelbrot equation. If we iterate the Mandelbrot equation long enough, the absolute values of some of the sequences will "blow up" to infinity, and some will cycle around with values less than 2. That is, the sequence stays bounded. It can be proven that if the absolute value ever exceeds 2 in the sequence it will always "blow up". The Mandelbrot set is all the values of c which give sequences that are bounded. The image below is a representation of the Mandebrot set:

The border of the Mandelbrot set is infinite in length, and is "self-similar". That is, any magnification of the border will look similar at any level of magnification.
From a fractal art perspective, it is the region where the Mandebrot sequences DIVERGE that is most interesting. Coloring the region outside the set can produce spectacular images, and so fractal images generated from functions like the Mandelbrot function are generally created from the divergent region of the functions. The areas of greatest interest, which produce images with the highest level of detail, are near the borders of the Mandelbrot set. This is illustrated in the next image, which uses a coloring method called "triangle inequality":

In the regions near the Mandelbrot set, the sequences, which are sometimes called "orbits" because if they are plotted they tend to follow ellipsoid or spiral paths, will eventually "blow up" to infinity. One method for coloring the divergent region is to set a threshold value, called a "bailout", If the absolute value of a member of the sequence exceeds the bailout value, then the point on the complex plane represented by c is colored according to the number of iterations needed to exceed the bailout. This was the first and most common way to color fractals. The next image is from a region near the Mandelbrot border colored in this manner. Definite bands of color, representing different levels of iteration, can be seen:
From an artistic perspective, it would be nice to have smooth coloration rather than the banding created by using the number of iterations to color the image. In 1995 Ron Barnett discovered and developed a new coloring method related to the number of iterations which provides smooth coloration for all types of iterated fractal images. Rather than using the number of iterations, the following iterated sum is used for coloration:
sn+1 = sn + e-||zn+1||
where ||zn+1|| is the absolute value of zn+1. Using this method, the image below is obtained:
This method is one of the standard coloring methods in the TrueMand program available for download from this site.
Fractal artists have developed many coloring methods which depend upon various characteristics of the sequences generated by iteration of the Mandebrot equation, and which provide extensive control of the type of image produced according to the artistic goals of the artist.
Julia Sets
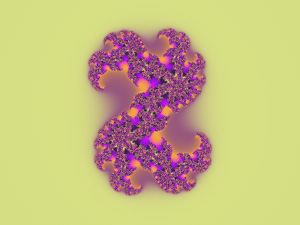
Closely related to the Mandelbrot set are the Julia sets. The same equation is used, but with somewhat different assigments to z and c. Consider the Mandebrot set and the area immediately surrounding it. Assign to c a point in the Mandelbrot set or its immediate surrounding region. This will be called a Julia set index. On a new graph ranging from -2 to 2 on the real X axis and ranging from -1.5 to 1.5 on the imaginary Y axis, choose a point on the graph and assign it to z0. Now iterate the equation. Do this for every point on the graph, using the same value of c for all iterations. This will generate a Julia set for the point c. The next two images are for Julia set indexed within the Mandelbrot set, starting close to the edge and moving towards the interior of the Mandelbrot set. Notice that the set has a more complex border when the index is closer to the Mandelbrot border. The coloring is set to show the convergent region of the Julia set only.
 |
 |
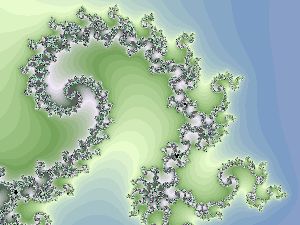
The next Julia set is indexed just outside the Mandelbrot set. Notice that the Julia set has broken up into multiple pieces. This defines another way to define the Mandelbrot set. The Mandelbrot set is the set of all Julia set indices for which the Julia set has a continuous border. Conversely, the Mandebrot set provides a map for generating Julia sets.
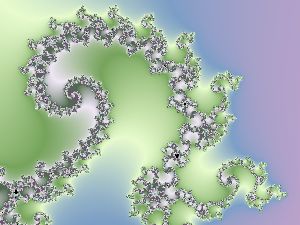
The last image shows the same Julia set indexed just outside the Mandelbrot set colored with the smooth coloring formula for the divergent region described above.